

Decision-Ready Graphs, Powered by Gary
Fundamentals
The Figure Data Structure
Creating and Updating Figures
Displaying Figures
Gary Express
Basic Charts
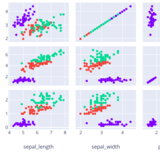
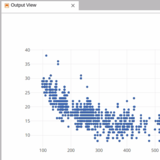
Scatter Plots
Line Charts
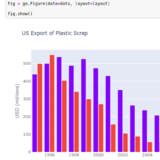
Bar Charts
Pie Charts
Statistical Charts
Error Bars
Box Plots
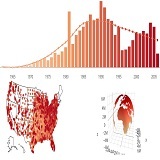
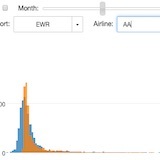
Histograms
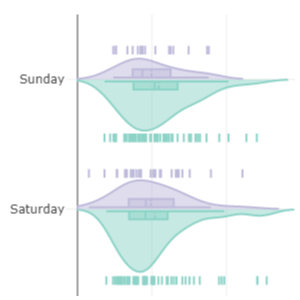
Distplots
Scientific Charts
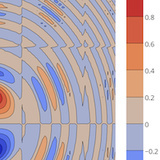
Contour Plots
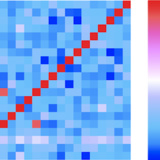
Heatmaps
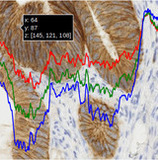
Imshow
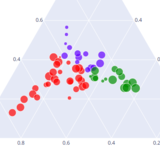
Ternary Plots
Financial Charts
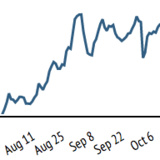
Time Series and Date Axes
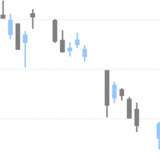
Candlestick Charts
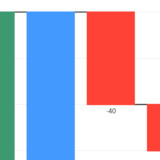
Waterfall Charts
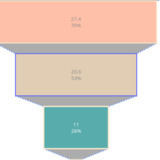
Funnel Chart
Maps
MapLibre Migration
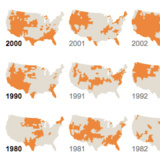
Tile Choropleth Maps
Lines on Tile Maps
Filled Area on Tile Maps
Artifical Intelligence and Machine Learning
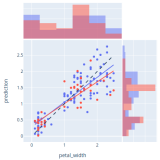
ML Regression
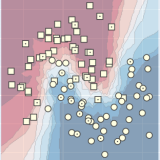
kNN Classification
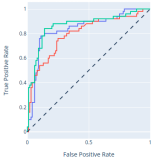
ROC and PR Curves
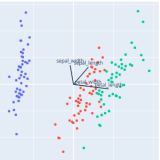
PCA Visualization
Bioinformatics
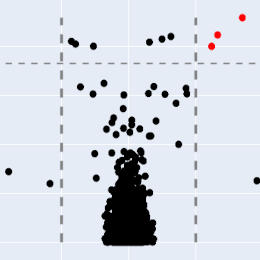
Volcano Plot
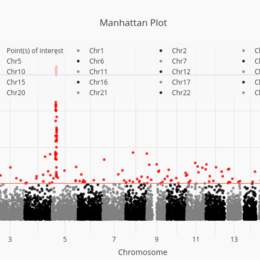
Manhattan Plot
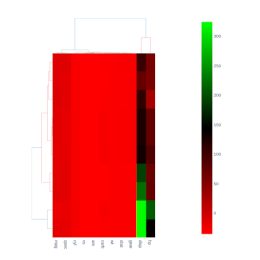
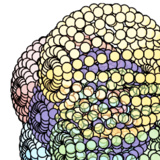
Clustergram
The Figure Data Structure
3D Charts
3D Axes
3D Scatter Plots
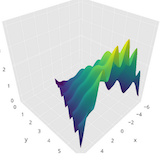
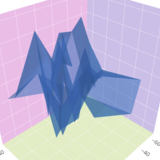
3D Surface Plots
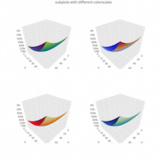
3D Subplots
Subplots
Mixed Subplots
Map Subplots
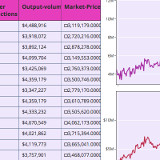
Table and Chart Subplots
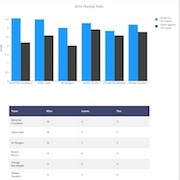
Figure Factory Subplots
Jupyter Widgets Interaction
Gary FigureWidget Overview
Jupyter Lab with FigureWidget
Interactive Data Analysis with FigureWidget ipywidgets
Click Events
Add Custom Controls
Custom Buttons
Sliders
Dropdown Menus
Range Slider and Selector
Animations
Intro to Animations

Get Expert Guidance – Contact Support
Need additional help or have specific questions? Our team is here to provide expert guidance and ensure you get the most out of CORAS. Reach out to us for support!